

Never Miss a Beat: Get a snapshot of the issues affecting the IT industry straight to your inbox.
When choosing a business intelligence product, it's easy to skip over what many users care about most: Microsoft Excel integration.
11 Min Read

Part four in a series of reviews evaluating business intelligence suites one functional area at a time.
One of the biggest mistakes you can make with BI is forgetting the big picture, the strategic goals of what you hope to accomplish by accessing this information. Are you hoping to increase sales by knowing the customer better or by discovering a new business opportunity? Are you hoping to better control costs to provide a competitive advantage? Will you use BI to measure performance against a number of goals?
In evaluating BI toolsets from a functional perspective, it's easy to get so caught up in the feature-by-feature comparison that you lose sight of the business goals of your BI implementation. I've compared selecting a BI tool to buying a car. In buying a car, we seldom talk about how we'll use the car or about the right way to drive. (A Hummer really may not be ideal for commuting 120 miles on the highway each day.) In buying a car, best practices and uses are partly assumed and partly forgotten amidst the excitement of the tangible features: It's so rugged, roomy, trendy! In selecting a BI tool, there's one user-wanted function area in particular in which we tend to skip completely, diving straight into the bells and whistles: It is Excel integration.
Although Excel may be the undisputedly leading BI tool, it's also the leading cause of multiple versions of the truth: Two users execute the same query against one central data warehouse and dump the data into Excel. One user filters the data in Excel with a particular set of criteria and adds some personal formulas. The second user filters it slightly differently and perhaps makes a mistake in a formula. Whose spreadsheet is right? An inordinate amount of time is spent reconciling the multiple versions rather than on gleaning business insight. The same process is repeated each time the query is refreshed and the results re-exported. With the Sarbanes-Oxley Act (SOX), using these processes for financial reporting can cause noncompliance as there is little assurance as to which spreadsheet is valid. Yet financial analysts are often the savviest Excel users. It is the tool they are most comfortable with. Although SOX may cover financial reporting, other regulatory reporting - whether through the EPA for environmental factors or the FDA for food and drugs - has equally strict validation requirements. One department of a pharmaceutical company I've worked with has specifically disabled the ability to export data to Excel just to ensure reporting compliance.
The Importance of Excel Integration
Despite the validity issues around spreadsheets, there are a number of compelling reasons why Excel integration is so important to a BI tool selection:
Tool familiarity. Users have so little time to get the data and then to analyze it that it's often easiest to use a tool they're already familiar with.
Ability to "massage" the data. "Massaging" the data includes re-sorting, filtering, creating formulas, and in some cases, fixing bad data. All of these things should ideally be done at early points in the BI process. In the "Reporting" segment of this BI Scorecard series, I talked about interactivity capabilities of a BI tool that let users re-sort, filter, or hide individual columns within the native BI tool. When this capability is disabled or unavailable, users have little choice but to dump the data into Excel. The more drastic task of actually correcting bad data within an Excel spreadsheet is clearly a nightmare for data consistency. However, if the processes aren't in place to fix bad data at the source or to correct programmatic ETL errors, users will do whatever it takes to create a usable report.
Better charting. Excel charts and all the controls over scaling, axes, and labels have become a de facto benchmark. If the BI tool doesn't provide robust charting capabilities, it's clear that users will want to export the data to Excel to access its charting capabilities. Some BI vendors provide charting options superior to Excel's; for others vendors, Excel is the standard.
Briefing books. Excel's ability to have multiple worksheets stored in one workbook file makes it appealing for management briefing books. Users can access all their data, perhaps populated from multiple data sources and queries in one file, offline. Few BI vendors can replicate this functionality natively. Dashboard capabilities are a robust alternative, but often require a network connection. Here, the manual processes to build Excel-based briefing books must be carefully evaluated against alternative solutions. A few vendors reviewed here offer spreadsheet add-ins that can help automate the process of building and refreshing Excel-based briefing books.
Reduced licensing costs. Companies have already incurred Excel licensing costs. If they can minimize the number of BI users by better leveraging Excel, then the theory goes that they can save on BI licensing costs. However, BI vendors are increasingly broadening the definition of "user." A BI user is no longer an individual who logs into the BI tool, but rather, any user who receives output (including spreadsheets) from the BI tool. Thus this last criterion is an invalid requirement.
One Version of the Truth
The preceding list offers some compelling reasons for integrating Excel with your BI tool. Unless there are strict regulatory requirements, restricting Excel use is pretty much a losing battle. The key, then, is to look for capabilities that provide Excel integration while also ensuring one version of the truth. There are a number of different ways in which a vendor accomplishes this goal. At the "zero support" end of the spectrum is the one-time export into Excel in which there is no audit trail of this export nor is there a link to the centrally maintained query. At the other "good support" end of the spectrum, the BI tool tracks ownership and changes made to the Excel spreadsheet, then stores the spreadsheet within the BI repository. The Excel spreadsheet can be refreshed with new data, typically by maintaining a link to the original query file. As the scorecard in Table 1 shows, there isn't one single feature that guarantees "one version of the truth"; it is fulfilled in part by features the vendor provides and in part by processes that you must implement.
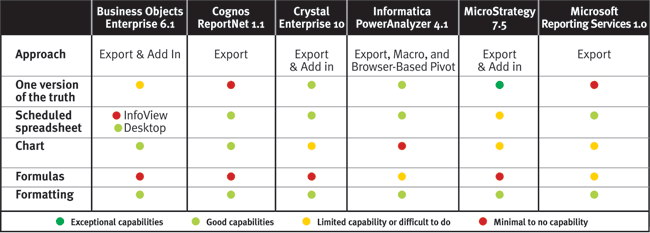
Table 1 Scorecard comparing Excel integration in several BI suites.
MicroStrategy's new Office product is an Excel-add in that lets users query and refresh an existing report from within a spreadsheet environment (see Figure 1) or from within PowerPoint and Word. When the original report definition or the underlying data changes, so does the spreadsheet. The same report view is accessed via the Web, desktop, and spreadsheet, providing users access via their preferred interface yet maintaining one version of the truth.
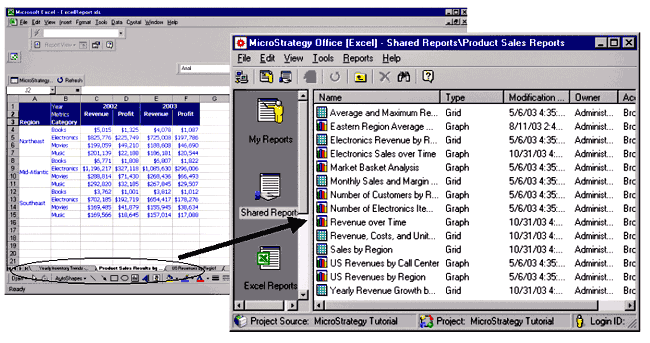
Figure 1 With the new MicroStrategy Office, shared reports on the server populate Excel spreadsheets. Each worksheet represents one report. One workbook can contain multiple reports.
Business Objects' add-in product, Business Query for Excel, lets users query a universe via a spreadsheet. ("Universe" is Business Objects' name for a business view, or metadata layer, that shields users from the complexities of the underlying database schema. See Part 1, "Query," for more detail.) Although this product has existed for years, it isn't widely used. Instead, users find it just as easy and faster to export data to Excel. (Note: The acquisition of OLAP@Work in 2000 led to a new version of the product, branded Business Query for Excel MD; this product is quite successful but can query only Microsoft Analysis Services.) Crystal version 10 introduced a new add-in as well, Crystal Enterprise Add-in for Use with Microsoft Excel.
Informatica's PowerAnalyzer offers two approaches to Excel integration. The first uses browser-based pivot tables, providing users with a familiar spreadsheet interface. The second uses an Excel-based macro (see the sidebar, "Methodology Note") to let users refresh the data from within a spreadsheet. In theory, the macro approach minimizes software maintenance compared to an add-in, but downloaded macros may be a security concern in some organizations. In addition, Microsoft's SOAP Toolkit needs to be installed. This toolkit is being phased out and replaced by .Net, forcing Informatica to look for alternative ways to deliver this functionality.
Scheduled Vs. One-time Export
Refreshing data directly from a spreadsheet is one approach to Excel integration. Scheduling a spreadsheet to be automatically generated is another. Here, you may start with an existing report layout and then schedule a query refresh along with the spreadsheet generation. The spreadsheet may be stored in the BI repository or distributed automatically via email. As discussed in Part 3 of this series (see Resources), Business Objects supports scheduled spreadsheet generation from the desktop but not via the InfoView portal. MicroStrategy has similar support via its Narrowcast server, which is not as well integrated as it could be. The other products reviewed here support scheduled output to Excel.
A one-time export to Excel is an organization's greatest challenge to maintaining one version of the truth, but it seems to be the most prevalent. If you're viewing a report that isn't filtered or sorted according to your needs, you simply save the data to Excel and do the analysis there. BI teams must be proactive: If many users are working this way, the BI team must provide better interactivity in the native BI tool or modify the standard report definition. If, however, it's an individual need, then the one-time export may be fine.
What's Exported?
When you export data to Excel, either on a scheduled basis or for a one-time save, what exactly is exported? Vendors historically have dumped all the detailed data into a spreadsheet but increasingly are exporting the formatting, charts, and formulas. All the vendors reviewed here now export formatting (bold, underline, column widths, and currency symbols, for example). Charts and formulas, however, have further to go. Business Objects (either desktop or WebIntelligence) and Cognos ReportNet 1.1 are the only products I've reviewed that export a chart as a native Excel chart that can be further modified. MicroStrategy Office can create a native Excel chart, but the export function doesn't. Other vendors export charts as pictures that aren't linked to the underlying data. Informatica PowerAnalyzer doesn't export charts at all and claims there hasn't been customer demand for it.
Report-based formulas aren't generally exported, either; the values are exported, but the formula itself isn't converted to an Excel formula. When the formula is exported, it provides excellent what-if analysis. For example, if you know a particular customer will be placing a large order, you can change the value in the spreadsheet. The new revenue totals are recalculated automatically. Informatica PowerAnalyzer is an exception in that it converts subtotals to Excel formulas. Microsoft Reporting Services has limited formula conversions when a report field is defined in a certain way. While Information Builders' WebFocus and Actuate's e.Spreadsheet Designer weren't reviewed in depth for this series, they both do better at generating Excel-based formulas.
Microsoft Reporting Services has a unique capability in that hyperlinks for subreports are maintained in the spreadsheet. (For more on subreports, see Part 2, "Reporting," in Resources.) Within the spreadsheet, you can click on a hyperlink that generates a subreport with all the correct filters passed through.
Versions Supported
In looking at Excel integration, pay careful attention to which version of Excel is required and whether there are differences in functionality across the versions. Microsoft Reporting Services, for example, requires Excel XP but is working on support for Excel 2000. Informatica PowerAnalyzer requires Excel 2002 to access Web-based pivot tables, though Excel 2000 is sufficient for exporting data to Excel. Cognos Report Net 1.0 exported only basic reports to a comma-separated values file, but the just-released 1.1 exports to native Excel.
CINDI HOWSON is the president of ASK, a BI consultancy. She coteaches The Data Warehouse Institute's "Evaluating BI Toolsets" and is the author of Business Objects: The Complete Reference (McGraw-Hill Osborne Media, 2003).
Resources
Part 1: Query Capabilities - March 20, 2004
Part 2: Reporting Capabilities - April 3, 2004
Part 3: Information Delivery - April 17, 2004
Part 5: OLAP - May 15, 2004
Part 6: Administration - June 1, 2004
Part 7: The Best BI Tool - June 12, 2004
Related product reviews available online at IntelligentEnterprise.com:
Actuate e.Spreadsheet Designer 10, March 6, 2004
Information Builders WebFocus 5, June 17, 2003
QlikTech QlikView Enterprise 6, Sept. 1, 2003
Methodology Note
Part 1 of this series contained a methodology note that described the hands-on evaluation of these products. This segment contains some exceptions to that methodology. The first: Excel integration for Cognos ReportNet changed dramatically in just-released 1.1; short time to press forced me to rely on scripted demos. The second: Technical difficulties left me unable to fully test Informatica's Excel macro functionality firsthand, so I relied partly on vendor documentation.
About the Author(s)
You May Also Like
More Insights
Editor's Choice


May 2, 2024
While there are plentiful options in cyber resiliency and business continuity tools and platforms, there isn’t one that can knock out everything from sudden cloud outages to prolonged ransomware attacks in a single punch. What can you do to keep the company on its feet no matter what is thrown at it? Find out in this new virtual event.
Reserve Your Seat Now