

Never Miss a Beat: Get a snapshot of the issues affecting the IT industry straight to your inbox.
The new application performance monitoring platform is more in sync with companies building applications as microservices.
4 Min Read
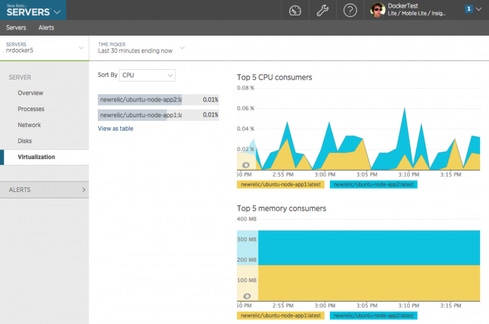
<p align="left">Container watching.</p>

Plan X: DARPA's Revolutionary Cyber Security Platform
Plan X: DARPA's Revolutionary Cyber Security Platform (Click image for larger view and slideshow.)
New Relic, which supplies application performance monitoring, has extended its cloud-based analytics platform so that it now can peer into a customer's Linux containers and monitor the performance of services running there.
The capability brings New Relic more in sync with how companies are starting to build applications -- as distributed sets of services, or microservices. The New Relic platform can already monitor an application when it's running on a bare metal server host or in a virtual machine. But its new capability adds visibility into Docker containers. Microservices are frequently deployed in multiple containers, whether on the same host or on different hosts.
This monitoring is a tricky technical challenge because of how containers are designed.
"A container by its nature is designed to throw up opaque software walls so its neighbors can't look over them and see what it's doing," said Patrick Lightbody, VP of product management at New Relic. Oftentimes the application owner can't see what's going on inside those walls either.
The just-announced New Relic platform now can report on the speed of application page-load responses, ping to test a particular application function, and assess how much CPU, memory, and storage the application inside the container is consuming. It can alert system admins to application errors encountered and lack of application availability. The container monitoring capabilities are still in public beta, with general availability to come later this year.
That monitoring promises to let application owners see both the host server and the containerized app and gauge how well each is running, instead of being thwarted by the increasing complexity of distributed applications.
[Want to learn more about cloud monitoring? See 2nd Watch, New Relic Monitor AWS Workloads.]
The New Relic announcement says the monitoring applies to containers "of all types," but in fact the public beta is only about monitoring Docker, the popular container formatting engine. If CoreOS's Rocket, Cloud Foundry's Garden, or some other Linux container format gains traction, New Relic will add monitoring support for it as well, Lightbody said in an interview.
Docker creates monitoring problems because, as the Docker Engine creates a new container, it assigns an arbitrary unique identifier for the container's host. A second new container will be given a different random identifier for the host. In that way, it would be hard for an intruder getting the host reference from one container to identify what other containers are running on the same host.
By the same logic, however, it's difficult for a monitoring system to figure out which containers are running on which host. New Relic can tell because it has an agent on the host and inside each container, allowing a comprehensive view of application performance to be drawn for a given hardware server.
In addition to container monitoring, the new version of New Relic's Software Analytics Platform includes the ability to produce service maps for monitoring complex microservice applications. The map can track application components and dependencies from the browser layer through the application server, database servers, and other backend services. It can also identify off-premises, third-party services. Service maps can be based on the role of the map user, giving a transaction system specialist or other IT manager a view into a chain of application services tied to a business process.
New Relic's also streamlining alerts in the latest version to avoid alert fatigue and let system administrators concentrate on a problem rather than face an onslaught of warnings. If one container is tying up resources on a host, ensuing problems with three other containers on the same host won't spawn a stream of alerts. The platform also groups related alerts of earlier incidents into an incident dashboard to give the system admin an understanding of the history of a performance problem.
New Relic Pro application performance monitoring starts at $149 a month per host server.
Lightbody also said New Relic is joining Cloud Foundry, the platform-as-a-service open source project initially started by VMware. New Relic plans to contribute a tile, service broker, and build pack to the project. The contributions are meant to make it easier for Cloud Foundry users to use New Relic.
About the Author(s)
You May Also Like
More Insights
Editor's Choice


May 2, 2024
While there are plentiful options in cyber resiliency and business continuity tools and platforms, there isn’t one that can knock out everything from sudden cloud outages to prolonged ransomware attacks in a single punch. What can you do to keep the company on its feet no matter what is thrown at it? Find out in this new virtual event.
Reserve Your Seat Now