

Never Miss a Beat: Get a snapshot of the issues affecting the IT industry straight to your inbox.
Analytics Showdown: Should Apps Be Simpler, Or Smarter?
Qlik, Tableau, and Salesforce.com are betting on simple analytic applications, while veterans IBM and SAS push smarter. What do you need?
5 Min Read
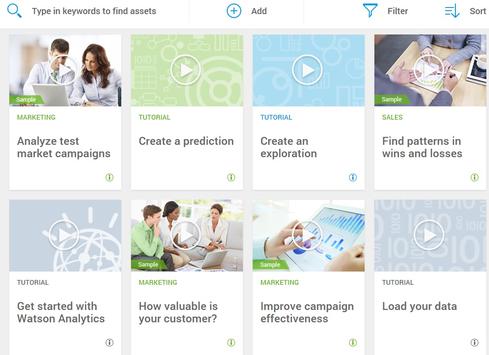
Task descriptions within Watson Analytics are simple and straightforward. Multiple video tutorials hint that this broad studio isn't stupid simple.
that SaaS vendors care about more than anything is adoption," says Bigelow. "It's a monthly subscription, and if you don't have usage, you don't have revenue."
However, as simple and usable as the mobile apps may be on the front-end, getting real value out of Wave Analytics will still require backend data integration work and developer/power user decisions about what data to combine and expose to end-users.
School of smarts
Among the vendors I would put in the "tools must be smarter" school of thought are IBM and SAS. IBM recently introduced Watson Analytics, a cloud-based service that promises to streamline high-end data analysis. Currently in beta and available (by invite only) after registering online, Watson Analytics makes heavy use of natural-language interaction. You start by uploading files, and you can then explore the data using visual tools. Alternatively you can type questions into an Internet search-style window, or apply use-case templates such as "Improve Campaign Effectiveness" or "Prevent Employee Attrition."
Despite the Watson branding, the service is not the same as IBM's cognitive computing technology, so you won't have to go through laborious training. Behind the scenes, the service combines technologies that IBM has been working on for some time. InfoSphere Data Refinery services, for example, are used to assess the data that you upload and automatically suggest corrections, such as deleting duplicates or merging records that appear to be related. The suggestions are presented in plain English, and users can accept or decline the changes.
Other IBM R&D at work includes Catalyst Engine, a tool that comes out of IBM's SPSS acquisition that's designed to automatically find correlations and trends in data. Watson Analytics also uses technologies from an IBM Labs effort called Project Neo that automatically suggest which type of visualization to use to best illustrate a trend, outlier, correlation, or other trait.
It's not as if IBM isn't thinking about making analysis simpler, since that is what all these natural language-interaction and auto-suggestion features deliver. But given the breadth of this online service, with multiple data-loading and data-cleansing options followed by multiple data analysis options and use-case scenarios, it feels more like a data analyst-oriented studio or suite rather than a simple data visualization tool.

Task descriptions within Watson Analytics are simple and straightforward. Multiple video tutorials hint that this broad studio isn't stupid simple.
SAS Visual Analytics is another broad option with built-in smarts. Introduced in 2012, this on-premises software also spots trends and patterns of interest within data sets and then suggests the types of visualizations that best expose those traits. In a Visual Analytics upgrade announced in October, SAS added "guided analytics" whereby users can define business goals, such as unit sales or profitability, and then see how other variables, such as marketing spend, material costs, or other inputs, will have to change in order to meet that goal.
This goal-seeking approach provides a new twist on widely available what-if analysis capabilities. Rather than wasting time manipulating data variables and then looking at the impact, you simply input the business outcome you're after -- like 25%-plus profit margin -- and the software shows you what conditions or combinations of conditions it will take to reach that goal.
Which approach wins?
Everyone wants software that's both simple and smart, no matter how tech-savvy they might be. IBM and SAS of course both argue that their smart features make their services and software simpler and easier to use, even for novices.
I put this idea of simplicity versus smarts in front of one super-experienced BI and analytics practitioner: Steve Rimar, senior staff IT architect at Qualcomm. The company has used a variety of different tools over the years, including Cognos, Microsoft, and BusinessObjects, but QlikView and Oracle OBIEE have emerged as Qualcomm's dominant corporate standards.
Qualcomm recently decided it needed something even simpler than QlikView to meet the needs of human resources and business executives. After an extensive review that also included Tableau Software, Qualcomm chose Qlik Sense for that role, and it's in the midst of big deployment. Familiarity with Qlik and the opportunity to swap and balance QlikView and Qlik Sense licenses had a lot to do with the selection, Rimar admits. But Qualcomm is keeping its options open and it's also doing a proof-of-concept project on Watson Analytics.
What's Rimar's take on software simplicity versus smarts?
"I always tell people that the future of BI is Google; it's a text box where you put questions in and get answers," Rimar says. "But today, no tool is smart enough to just tell you the right answers. You have to minimize potential errors by having power users pull the right data together so self-service business, finance, and sales users -- or whoever they may be -- can draw conclusions from clean data sets."
The future will undoubtedly bring more new products that combine simple, intuitive interfaces with built-in auto-suggestion features. Simplicity and software smarts both help, but for the foreseeable future, human expertise still will be required to put the right data together and then explore and visualize it to come up with valid conclusions.
Apply now for the 2015 InformationWeek Elite 100, which recognizes the most innovative users of technology to advance a company's business goals. Winners will be recognized at the InformationWeek Conference, April 27-28, 2015, at the Mandalay Bay in Las Vegas. Application period ends Jan. 16, 2015.
About the Author(s)
You May Also Like
More Insights
Webinars
Editor's Choice


May 2, 2024
While there are plentiful options in cyber resiliency and business continuity tools and platforms, there isn’t one that can knock out everything from sudden cloud outages to prolonged ransomware attacks in a single punch. What can you do to keep the company on its feet no matter what is thrown at it? Find out in this new virtual event.
Reserve Your Seat Now