Standard Reports: Basics for Business Users
Here's how to plan, prioritize and design standard BI application reports.

Business people should be eager to dive in and explore the data that represents their business. After all, who knows better what information is needed? Unfortunately, few business people seem to agree. Consider yourself lucky if 10 percent of your users actually build their own reports from scratch.
As for the other 90 percent of the user community, it's up to every data warehouse (DW)/business intelligence (BI) team to provide an easier way to access the data. Here's a process for designing a starter set of BI application standard reports.
What Are BI Applications?
There's no commonly accepted definition of BI or a BI application, so we're offering our own: BI applications are the delivery vehicles of business intelligence — the reports and analyses that provide usable information to the business. BI applications include a broad spectrum of reports and analyses, ranging from simple fixed-format reports to sophisticated analytics with complex embedded algorithms and domain expertise. It helps to divide this spectrum based on the level of sophistication. We call the simple side standard reports and the complex side analytic applications.
It's possible to build BI applications without the benefit of a data warehouse, but this rarely happens. A well-built data warehouse adds value through the business dimensional model and the ETL process, so it makes no sense to replicate this effort to build a standalone BI application. Most successful BI applications are an integral part of the user-facing end of the data warehouse.
Standard reports usually have a fixed format, are parameter-driven and, in their simplest form, are prerun. Standard reports provide a core set of information about what's going on in a particular business area — sounds dull, but these reports are the backbone of BI applications. Examples from different industries include YTD Sales vs. Forecast by Sales Rep, Monthly Churn Rate by Service Plan and Direct Mail Response Rates by Promotion by Product.
The standard reporting system consists of several technology components. You must have a tool for the report designer — either someone in IT or a skilled business user — to define reports. You need management services for report storage, execution and security. Finally, your reporting system should have a navigation portal that helps users find the report they want.
Analytic applications are more complex than standard reports. They center on a specific business process and encapsulate domain expertise about how to analyze and interpret that process. They may include complex algorithms or data-mining models. Some analytic applications give users the advanced capability to feed changes back into the transaction systems based on insights gained using the application.
Others are sold as black-box or hosted systems. Common examples of analytic applications include budgeting and forecasting systems, promotion-effectiveness and category-management applications, fraud detection and Web path analysis.
Build vs. Buy
Most organizations build their own standard report set, using a purchased reporting tool to design and publish the reports on the corporate intranet — usually in an accompanying reporting portal. There are many popular tools that make it easy to define and publish reports and to customize the bundled portal.
The build versus buy decision for analytic applications is more complex. The market for packaged applications is growing both in quantity and quality, and it's increasingly common for organizations to buy them. However, almost every implementation of a packaged analytic application requires significantly more customization than required for a prebuilt transaction system. Evaluate a packaged application for its flexibility and ease of customization. Is it based on a well-designed dimensional model? If so, it should be easy to map your data model to that of the application. If the data model is tightly tied to the application itself, implementation may require significant effort, even if the application is sourced from your dimensional data warehouse.
Some organizations still build custom analytic applications, using a combination of standard tools and custom code to capture and apply best-practice business rules. Organizations with particular expertise in analyzing their business processes or that have unusual systems and business models are more likely to build their own applications.
Designing the Reporting System
You can't build reports until you near the deployment of the DW/BI project, but you can and should start the design process much earlier. As soon as you've finished interviewing business users about their information and analytic requirements, you can create your report specifications — the longer you wait, the harder it will be to remember the details. This step includes the following tasks:
Create the target report list. It's important to deliver value to business users as quickly as possible; don't wait for hundreds of reports to be developed and tested before letting users into the system. Identify 10 to 15 reports you'll create for the first round.
The best way to create the target report list is to start with a full list of candidate reports by reviewing the business requirements for every information request, desire or fantasy that anyone expressed. Give each report a name and description, and on a scale of one to 10, rate its business value and the effort it will take to build.
Once you have a complete list of candidates, prioritize them, group related reports and review the priorities with a small group of competent, interested business users. Negotiate a cutoff point for the initial delivery at 10 to 15 reports. Remind users that many of the lower-priority reports can be handed off to the departmental experts who were most interested in them.

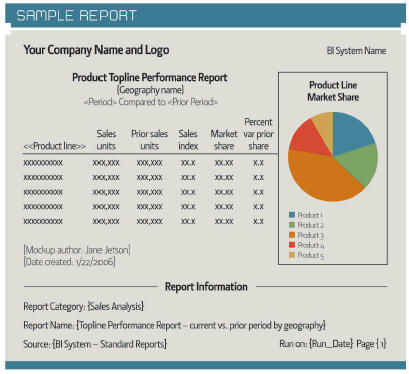
Create the standard template. Think of the reporting system as a publication and yourself as the editor. To communicate effectively, you need consistent format and content standards. Create a template identifying the standard elements that will appear on every report (see mock-up, below). The basics include:
Report name and title
Report body
Data justification, data precision and data format
Column and row heading format
Background fills and colors
Formatting of totals and subtotals
Header and footer
Report name and navigation category
Report run date and time
Data source(s) and parameters used
Report notes, including important exceptions, such as "Excludes intracompany sales."
Page numbering
Confidentiality statement
DW/BI reference (name and logo of the DW/BI system)
Report file name
Not all report information is displayed on the report itself. Use a specification document or repository to collect the following report metadata:User variables and other user interactions such as drill downs
Report calculations, derivations, author and date created
Security requirements
Execution cycle or trigger event, if the report runs automatically
Delivery mechanisms, such as e-mail, Web site, file directory or printer
Standard output format, such as HTML, PDF or Excel
Page orientation, size and margin settings
Create report specifications and documentation. For each report on the target list, create a specification that includes the following components:
Report template information as outlined above
Report mock-up
User interaction list
Detailed documentation
Report mock-ups are a great way to communicate the content and purpose of the reports. Use symbols to denote functions, such as:
< > = User entered variable
< < > > = Drillable field
{} = Application entered variable
\\ \\ = Link to another report or documentation source
( ) = Page or section break field
[ ] = Report template comments
The function symbols tell you what kind of interaction is possible, but they don't specify how that interaction works. Create a user interaction list to identify the nature and degree of interaction a user may have with each report, including variable specification, pick list descriptions, drill down and field addition or replacement.
Document required information not directly associated with the report display, such as the report category, the sources of the data, the calculations for each column and row, and any exceptions or exclusions to build into the query. You can append this document to the user interaction list.
The mock-up, user interaction list and additional documentation must provide enough information so that a developer can build the report.
Design the navigation framework. Once you know which reports to build, categorize them. This structure should enable anyone who knows something about your business to find what they want quickly. The best approach is to organize the reports by business process — just like the data warehouse bus matrix. This navigation framework is the primary entry point into the BI system. We call it the BI portal.
Conduct a user review. Review the report specifications with the user community to:
Validate your choice of high-priority reports and test the clarity of the specifications.
Validate the navigation hierarchies in the BI portal.
Involve users in the process, emphasizing their roles and developing their commitment.
Give users a sense of what will be possible in just a few months' time.
Once the specs have been reviewed, you can put them on the shelf until it's time to develop the reports. They'll be useful if you evaluate front-end tools, as the candidates should be able to easily handle the range of reports in the initial report set.
In a Nutshell
BI applications — whether standard reports or advanced analytic applications — are typically the only access to your DW/BI system for 90 percent of business users. Standard reports are the backbone of the system, so you need to do a great job designing them and creating a navigation framework. Do this work early in the project, when business users' requirements are fresh in your mind.
When the hard technical work of building and populating the data warehouse nears completion, it's time to think about the BI applications again. That's when you'll pull your target list specs off the shelf and build the standard reports and BI portal, including plans for maintaining, extending, securing and tuning the reports — issues we'll discuss in an upcoming column.
Warren Thornthwaite and Joy Mundy are members of the Kimball group and authors of The Microsoft Data Warehouse Toolkit (Wiley, 2006), from which this article was excerpted. Write to them at [email protected] and [email protected].
Quick Study
BI application standard reports are the primary vehicles for delivering business intelligence to the vast majority of users. Soon after gathering user requirements, take the following approach to design a starter set of standard reports for each business process dimensional model in your data warehouse:
Create the target list of high-priority reports.
Design a template that identifies the report layout and content.
Create specifications and documentation for each target report.
Design a navigation framework to organize reports and make it easy for users to find the information they need.
Review the report specs and navigation framework with key business users.
Required Reading
"Kimball Design Tip #58: The BI Portal," www.kimballgroup.com/html/designtipsPDF/KimballDT58TheBIPortal.pdf
"The Microsoft Data Warehouse Toolkit: With SQL Server 2005 and the Microsoft Business Intelligence Toolset," by J. Mundy and W. Thorthwaite (Wiley, 2006), Chapter 8
About the Author
You May Also Like


