Simple Tool to Identify Data Fraud: Benford's Law
This Simple, old school fraud detection tool for data can help weed out problems in a number of different scenarios.

Please consider these three scenarios:
Scenario 1 -- The principle investigator of a large study on urban homelessness has twenty research assistants (RAs) tasked with collecting data from people who live on the streets and in shelters. Four of the 20 RAs collude into an agreement to make up data on the amount of money the homeless receive per year by soliciting strangers. This allows the RAs to get paid while reducing some of their contact with this population.
Scenario 2 -- The person responsible for reading water meters has back problems. It has become too painful to repeatedly bend over, read the meters, and then walk 10 feet to the next meter. The meter technician decides to make up the data on the meter readings. She has an idea of what the readings should register, so making up the readings is not hard.
Scenario 3 -- A dealer of pre-owned cars works in a competitive market. Corporate headquarters has informed him that his quarterly sales performance is sub-optimal. The dealer has the mileage rolled back on the cars to create the perception that the inventory is less aged, and becomes more likely to be sold.
So as an analytics professional, how would you efficiently and effectively detect these fraudulent actions? One effective method is the deployment of Benford's Law.
Benford's Law (also known as the law of first-digits) is a principle regarding frequency distributions. Specifically, in natural collections of numbers, the leading digit is likely to be a 1, and will make up about 30% of the distribution. Please see this graph.
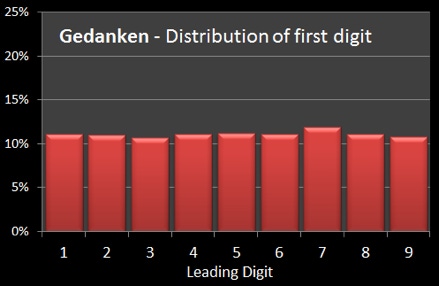
The reason why this method is effective is because the natural tendency for people falsifying data is to make an equal distribution of numbers (graph on the left). However physicist Frank Benford, building upon the work of Simon Newcomb, confirmed that the natural distribution of numbers (based on the first digit) is diametrically opposite to the value of the numbers. The lowest numbers are more frequent and the highest numbers are less frequent (second graph ).

So what does this mean regarding fraud detection in the three scenarios? It means that: (1) the amount of solicited cash received by the homeless, (2) the meter readings recorded by the technician, and (3) the mileage on the odometers could all be tested with a frequency distribution of the first digits.
The beauty of this old school method of fraud detection is three-fold. First, the concept is easy to understand. People intuitively believe that all natural, social, and behavioral patterns are always randomly distributed in equal fashion. The fact is that as it relates to certain numeric distributions that is not the case. Second, the concept is easy to calculate. Parse the first digit of a series of numbers and count them. Third, the concept does not require large financial investments in analytics software or training. You might need to do some programming (i.e., transform the numbers into character strings and then parse the first digit), but nothing requiring spending a lot of money on software or a class.
Does Benford's Law have limitations? Sure. Numeric series (1) where the numbers have been assigned sequentially, (2) that have constructed minimum and maximum values, (3) consisting of square roots, and (4) other situations where the range of numbers is not natural and have fixed end points. But for accounting, election data, economic data, or as in the scenarios -- revenue, meter readings, or odometer readings, Benford's Law can be very effective.
So in seeing this old school fraud detection tool, can you think of any other scenarios where this could be effective? Please share.
About the Author
You May Also Like


