Using The Force On Big Data
A fun experiment about the Star Wars expanded universe could lead to very real big data breakthroughs.

A galaxy far, far, away can help us learn more about our own world. Researchers at Swiss University, École Polytechnique Fédérale de Lausanne, have used a new computer algorithm to map the entire expanded Star Wars universe. The data absolutely qualifies as "big data" and learning how to compile and visualize it could lead to breakthroughs in multiple industries.
The program has created beautiful visualizations of connections between characters, pie charts demonstrating the mix of different races in the universe, tracked planets, Jedi, Sith, and other data from 36,000 years of Star Wars history chronicled in every piece of Star Wars storytelling from novels to video games. This accounts for over 21,000 characters, including over 19,000 characters with names and other identifying factors.
The data visualization is often quite beautiful, including the above network of how the characters were attached.
And it is just fun to see how many Wookies and Bothans there were floating around.

But besides good, clean, geeky fun, there is a method to all of this madness. The point of the EPFL study is to test a system designed to pull together data from giant data sets and build connections and links automatically, and then visualize that data.
Essentially, the first part isn't that hard. It is essentially a web scraper. They get most of their data from Wookiepedia, a fan site dedicated to Star Wars and edited like Wikipedia. Wookiepedia is a wonderful labor of love created by humans over a period of years. The problem is that connections from character to character in Wookiepedia are incomplete and human driven. It would take years or even decades to pull all of these connections together by hand. To get a sense of the way all the characters are related in the Star Wars Universe is impossible without a second step.
The second step, drawing connections between characters is the step that has value outside of Star Wars. According to the press release, "the algorithms developed by the LTS2 researchers offer a service that cannot be matched by human beings. In addition to extracting data according to extremely precise criteria, the algorithms can also create links among data points, sort them, quantify them, interpret them and find missing information. All this in very little time. The results are then presented in the form of interactive charts that are easy to read and understand."
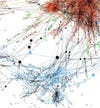
To see that in action, check out this network image:

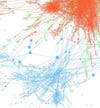
The black dots represent missing information. In this case, we're missing the time the character existed in the story. Because the Star Wars Universe runs over 36,000 years, it isn't always easy to know exactly what time or place a character interacted. However, the algorithm uses the connection points of other, more known characters to fill in the blanks. For instance, we know how long Luke Skywalker lived in the Star Wars extended universe. If a character is connected to Luke, we can narrow down the time period. Narrow a character down by dozens or hundreds of connections and the algorithm can put a fairly certain time and place label on the character.
Here is the filled in information:

The potential for this is rather huge. One could easily see information like this being used to look at patient populations for medical research. If you scraped data from patient databases based on genetic markers, you could, for example, quickly identify (or at least rule out) specific genes that might cause a certain illness. Filter the same group for age and lifestyle and environmental connections and you could quickly get a picture of large patient groups and perhaps how to treat or prevent the illness.
Being able to visualize complex and large data sets has always been a major big data problem. So you could really apply it to any large dataset where visualization is difficult. Plus, you can do cool stuff with it like count the exact number of Jedi Knights that were Bothans and lived during the Old Republic. Yeah, I got a little geeked out over that. But the potential is real and not just some hokey religion as Han Solo calls the Force.
About the Author
You May Also Like


