Big Data Helps 'Krochet Kids' Stay In The Loop
Nonprofit uses data visualization tools to track economic, health, and social wellbeing of female workers in developing nations.


12 STEM Resources For Young Women
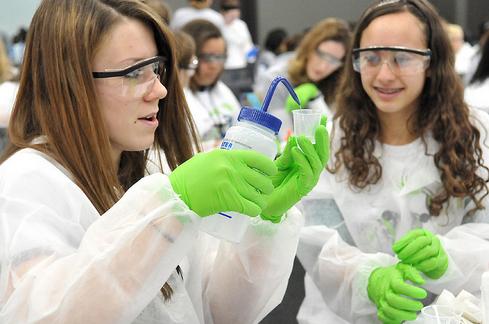
12 STEM Resources For Young Women (Click image for larger view and slideshow.)
Big-data-style visualization dashboards typically aren't associated with the world's poorest regions, places where electricity and Internet access are intermittent at best. But a small nonprofit is changing that assumption in developing areas of Uganda and Peru.
Krochet Kids teaches crocheting skills to around 285 women in these areas. Its goal is to equip disadvantaged people with skills and resources to "rise above poverty," said Adam Thomson, Krochet Kids' vice president of impact, in a phone interview with InformationWeek.
"We provide our program for extremely vulnerable women," said Thomson, adding that organization's chief goal is to help people "make the journey from vulnerability to… thriving."
The Krochet Kids story began in 2007 when a trio of Spokane, Wash., high school boys realized they could profit from their admittedly unusual hobby -- crochet -- by knitting caps for their fellow students, explains CEO and co-founder Kohl Crecelius in this 2012 video.
[Can technology affect income? Read Digital Business Side Effect: Income Disparity.]
The hobby evolved into a full-fledged business the following year, as the group sought ways to combine their three primary interests -- crochet, travel, and surfing -- into a global venture that could have a meaningful social impact as well.
"We started in Uganda, took a bunch of bags of yarn out there, and taught six ladies how to crochet," said Thomson. "Now we have about 185 people in Uganda and close to 100 in Peru, and our distribution takes us all over the US and the world. It's developed quite a bit."
Krochet Kids' program model is simple. "We provide four things to women who work for us," Thomson told us. "We provide jobs; women come and make Krochet Kids products. We sell those products here in the US, and the profits sustain 85% of the organization."
The organization mentors and educates its workforce as well, which is where data analysis comes into play.
Each crocheter is paired with a social worker, or mentor, who collects and analyzes data on 45 indicators in six developmental categories: economic, intellectual, physical, social, psychological, and spiritual.
The mentors "sit down with the women for an hour once a month to do the data collection," said Thomson.
Mentors use pencil and paper to collect this information, which is then entered manually into Google Forms. Krochet Kids uses Tableau Software's data visualization tools to pull insights from the monthly reports.
"Basically, I get the data, clean it, upload it via Tableau, and then our social workers and program teams… can see it in a really useful and manageable way."
Krochet Kids uses this data in several ways.
"It allows us to provide a really relevant service to each individual who enters our program. Each woman has a dashboard with those 45 indicators on it, and our social workers can look at the data and understand where [each participant's] strengths and weaknesses are."
The dashboards help Krochet Kids see where each participant "is succeeding and where she's challenged."
Data visualization also helps mentors determine the best times to focus on specific development areas.
"We're able to see changes in the first couple of months of the program, and changes in the latter stages. This affects the type of services we offer."
Savings strategies, for instance, should be caught later rather than sooner.
"We've learned things like personal budgeting and savings really start to take off in the six- to eight-month period. We have data to back this up. It's a trend," said Thomson. "So we don't do savings right off the bat. We know the women are going to spend their money on quality-of-life improvements in the first couple of months, and then at the sixth month, they'll start to think about savings."
Apply now for the 2015 InformationWeek Elite 100, which recognizes the most innovative users of technology to advance a company's business goals. Winners will be recognized at the InformationWeek Conference, April 27-28, 2015, at the Mandalay Bay in Las Vegas. Application period ends Jan. 9, 2015.
About the Author
You May Also Like


